Self-Service Data Ingestion
Allows internal teams to onboard their data sets to the data warehouse and schedule automatic ingestion
Situation: Internal teams needed a way to self-serve onboarding their data sets to the data warehouse. The existing process required creating tickets for the data warehouse teams to do this manually, which required getting priority in a sprint and waiting weeks until resolved.
Task: Design an application that collects information about the data set, ensures it’s formatted correctly, sets up space and permission on the server to accept the data upload, and optionally schedules it to auto-ingest.
Result: An application that reduced a 2-3 week manual process across teams down to a 7-10 minute task users could do themselves. We made a lot of people happy and I learned a lot about data sets and formats.
Actions:
Project management
Competitive research
User interviews & testing
Task flows
Wireframes
Light visual design
User guide creation
Beginning
While my engineering team was pretty clear on what needed to happen, because they would be users themselves, I needed some help understanding this complex project and the basics of data storage and transfer. My lead engineer teammate was fantastic in explaining the details so I could better understand what I needed to build. We started with a lot of whiteboarding, and I asked a TON of questions. My google-fu also proved useful in surfacing information that helped complete the picture.
Task Flows
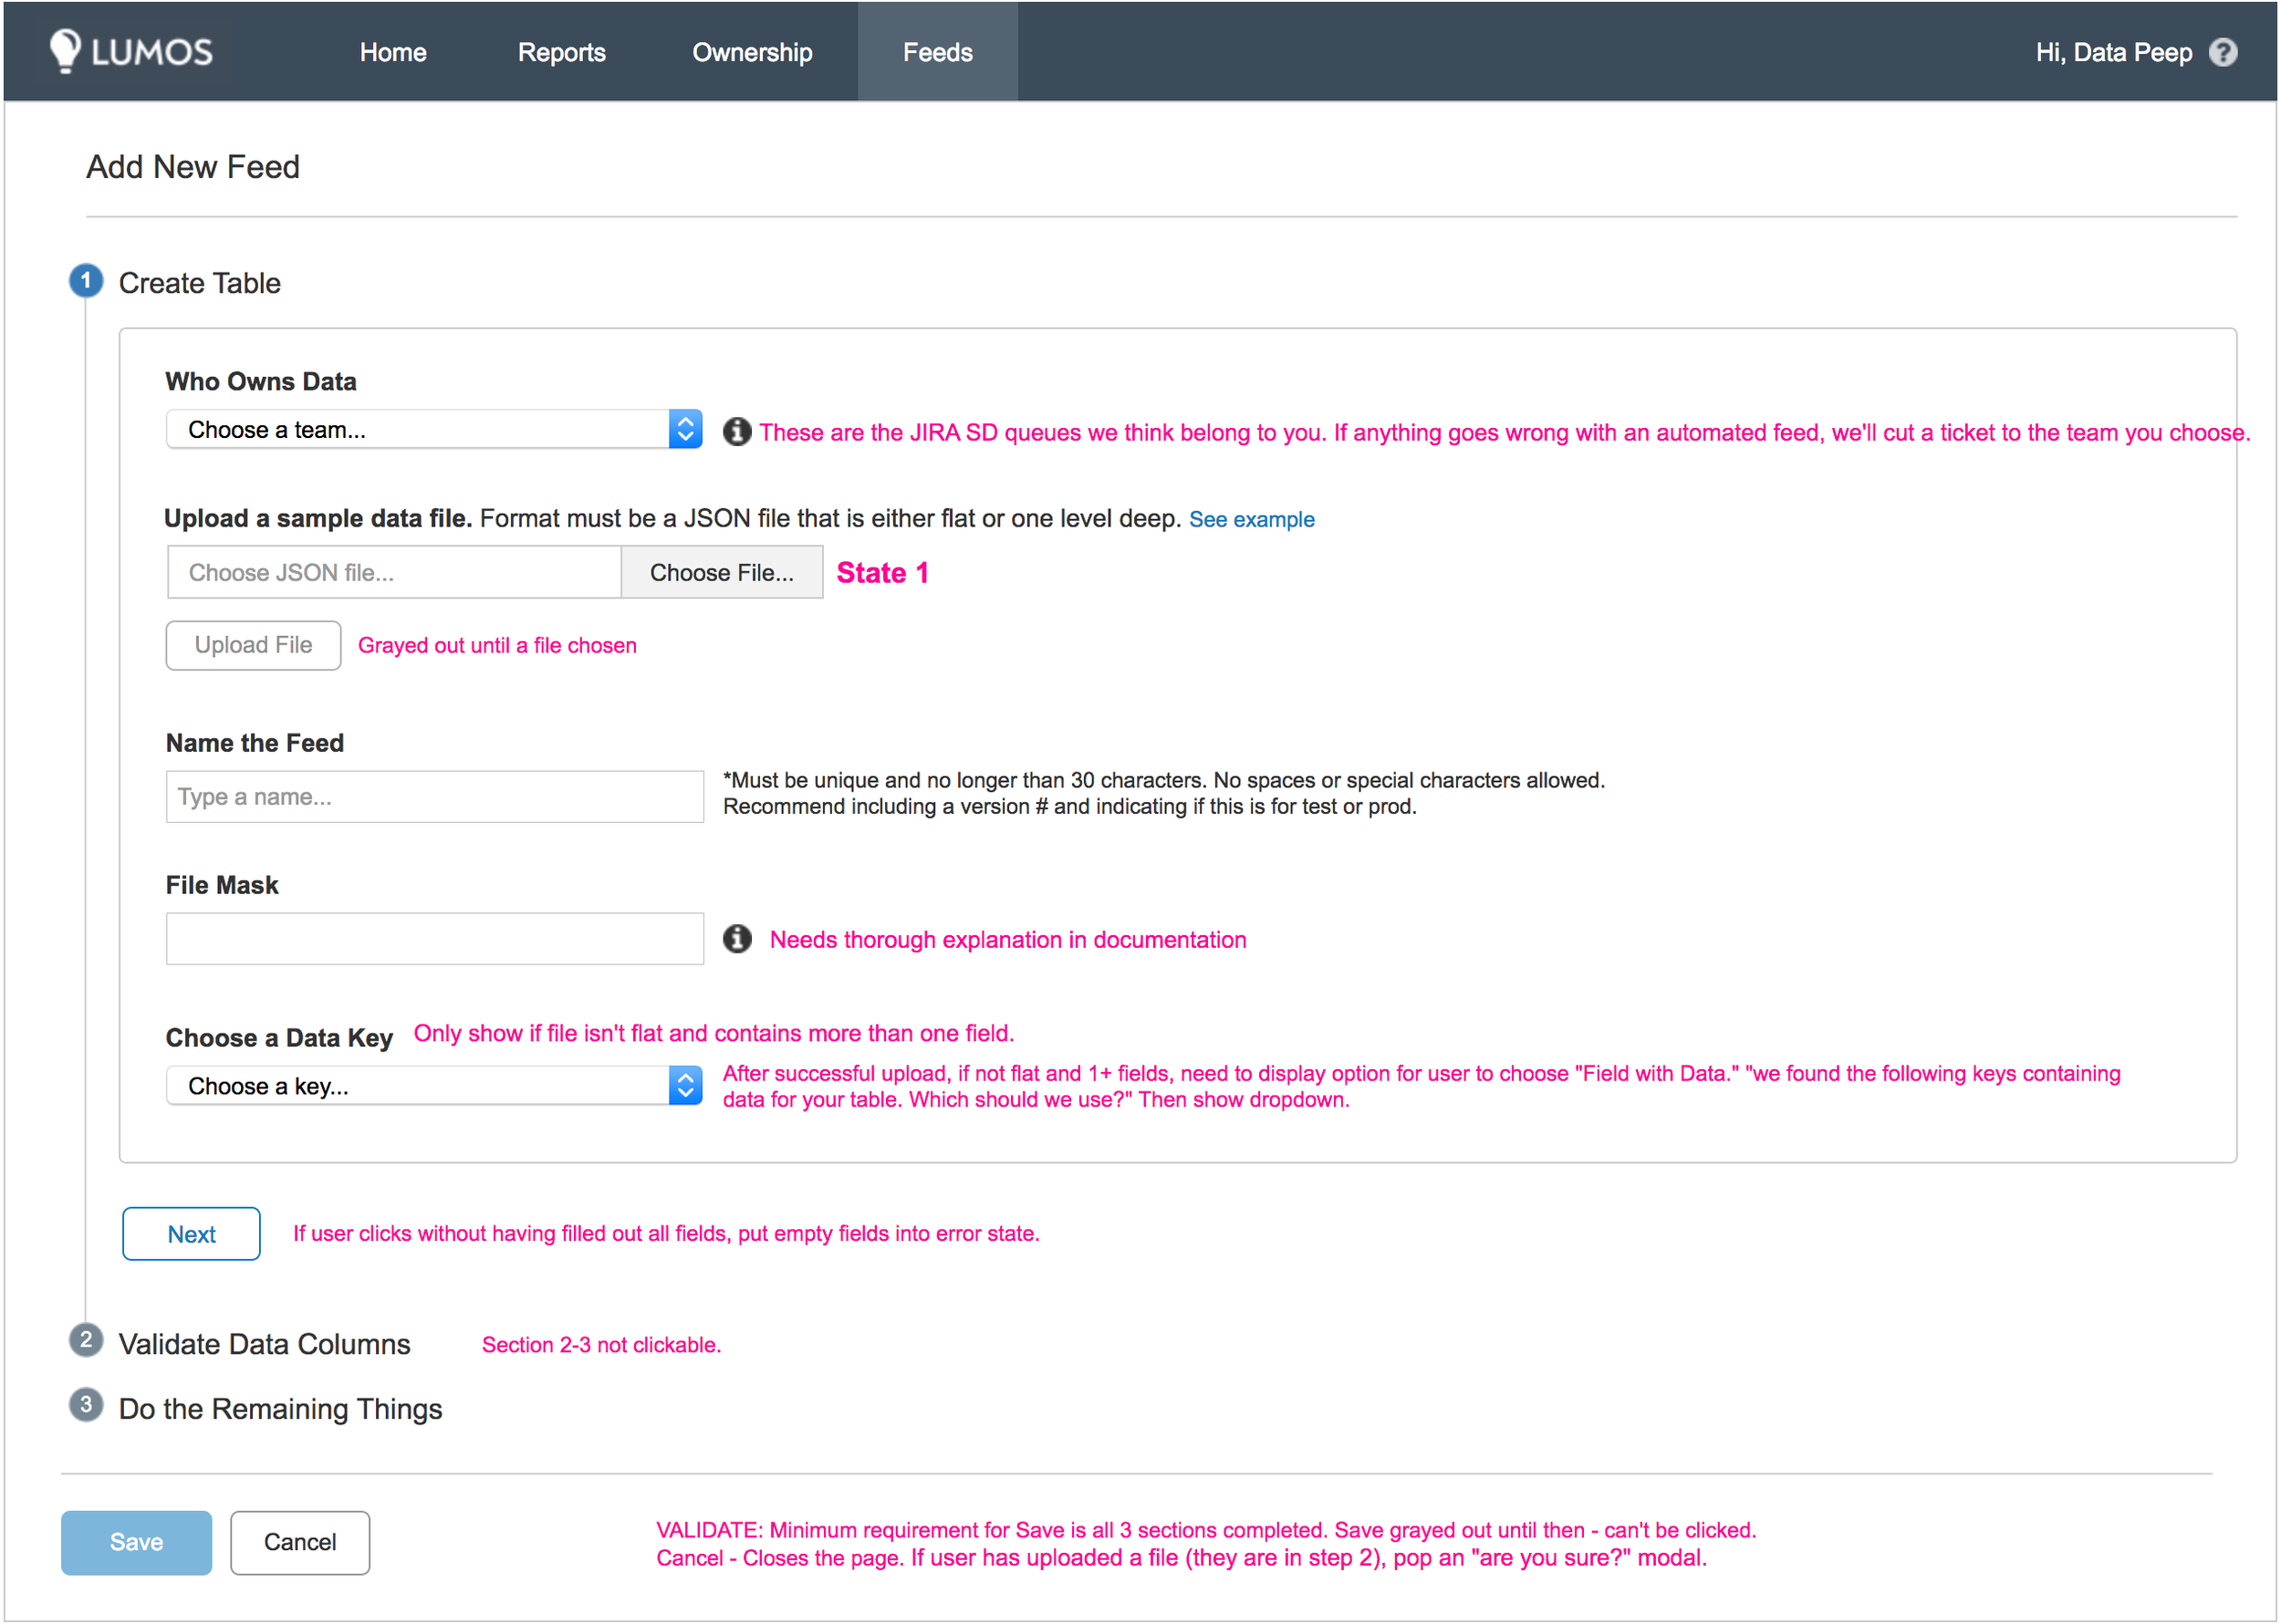
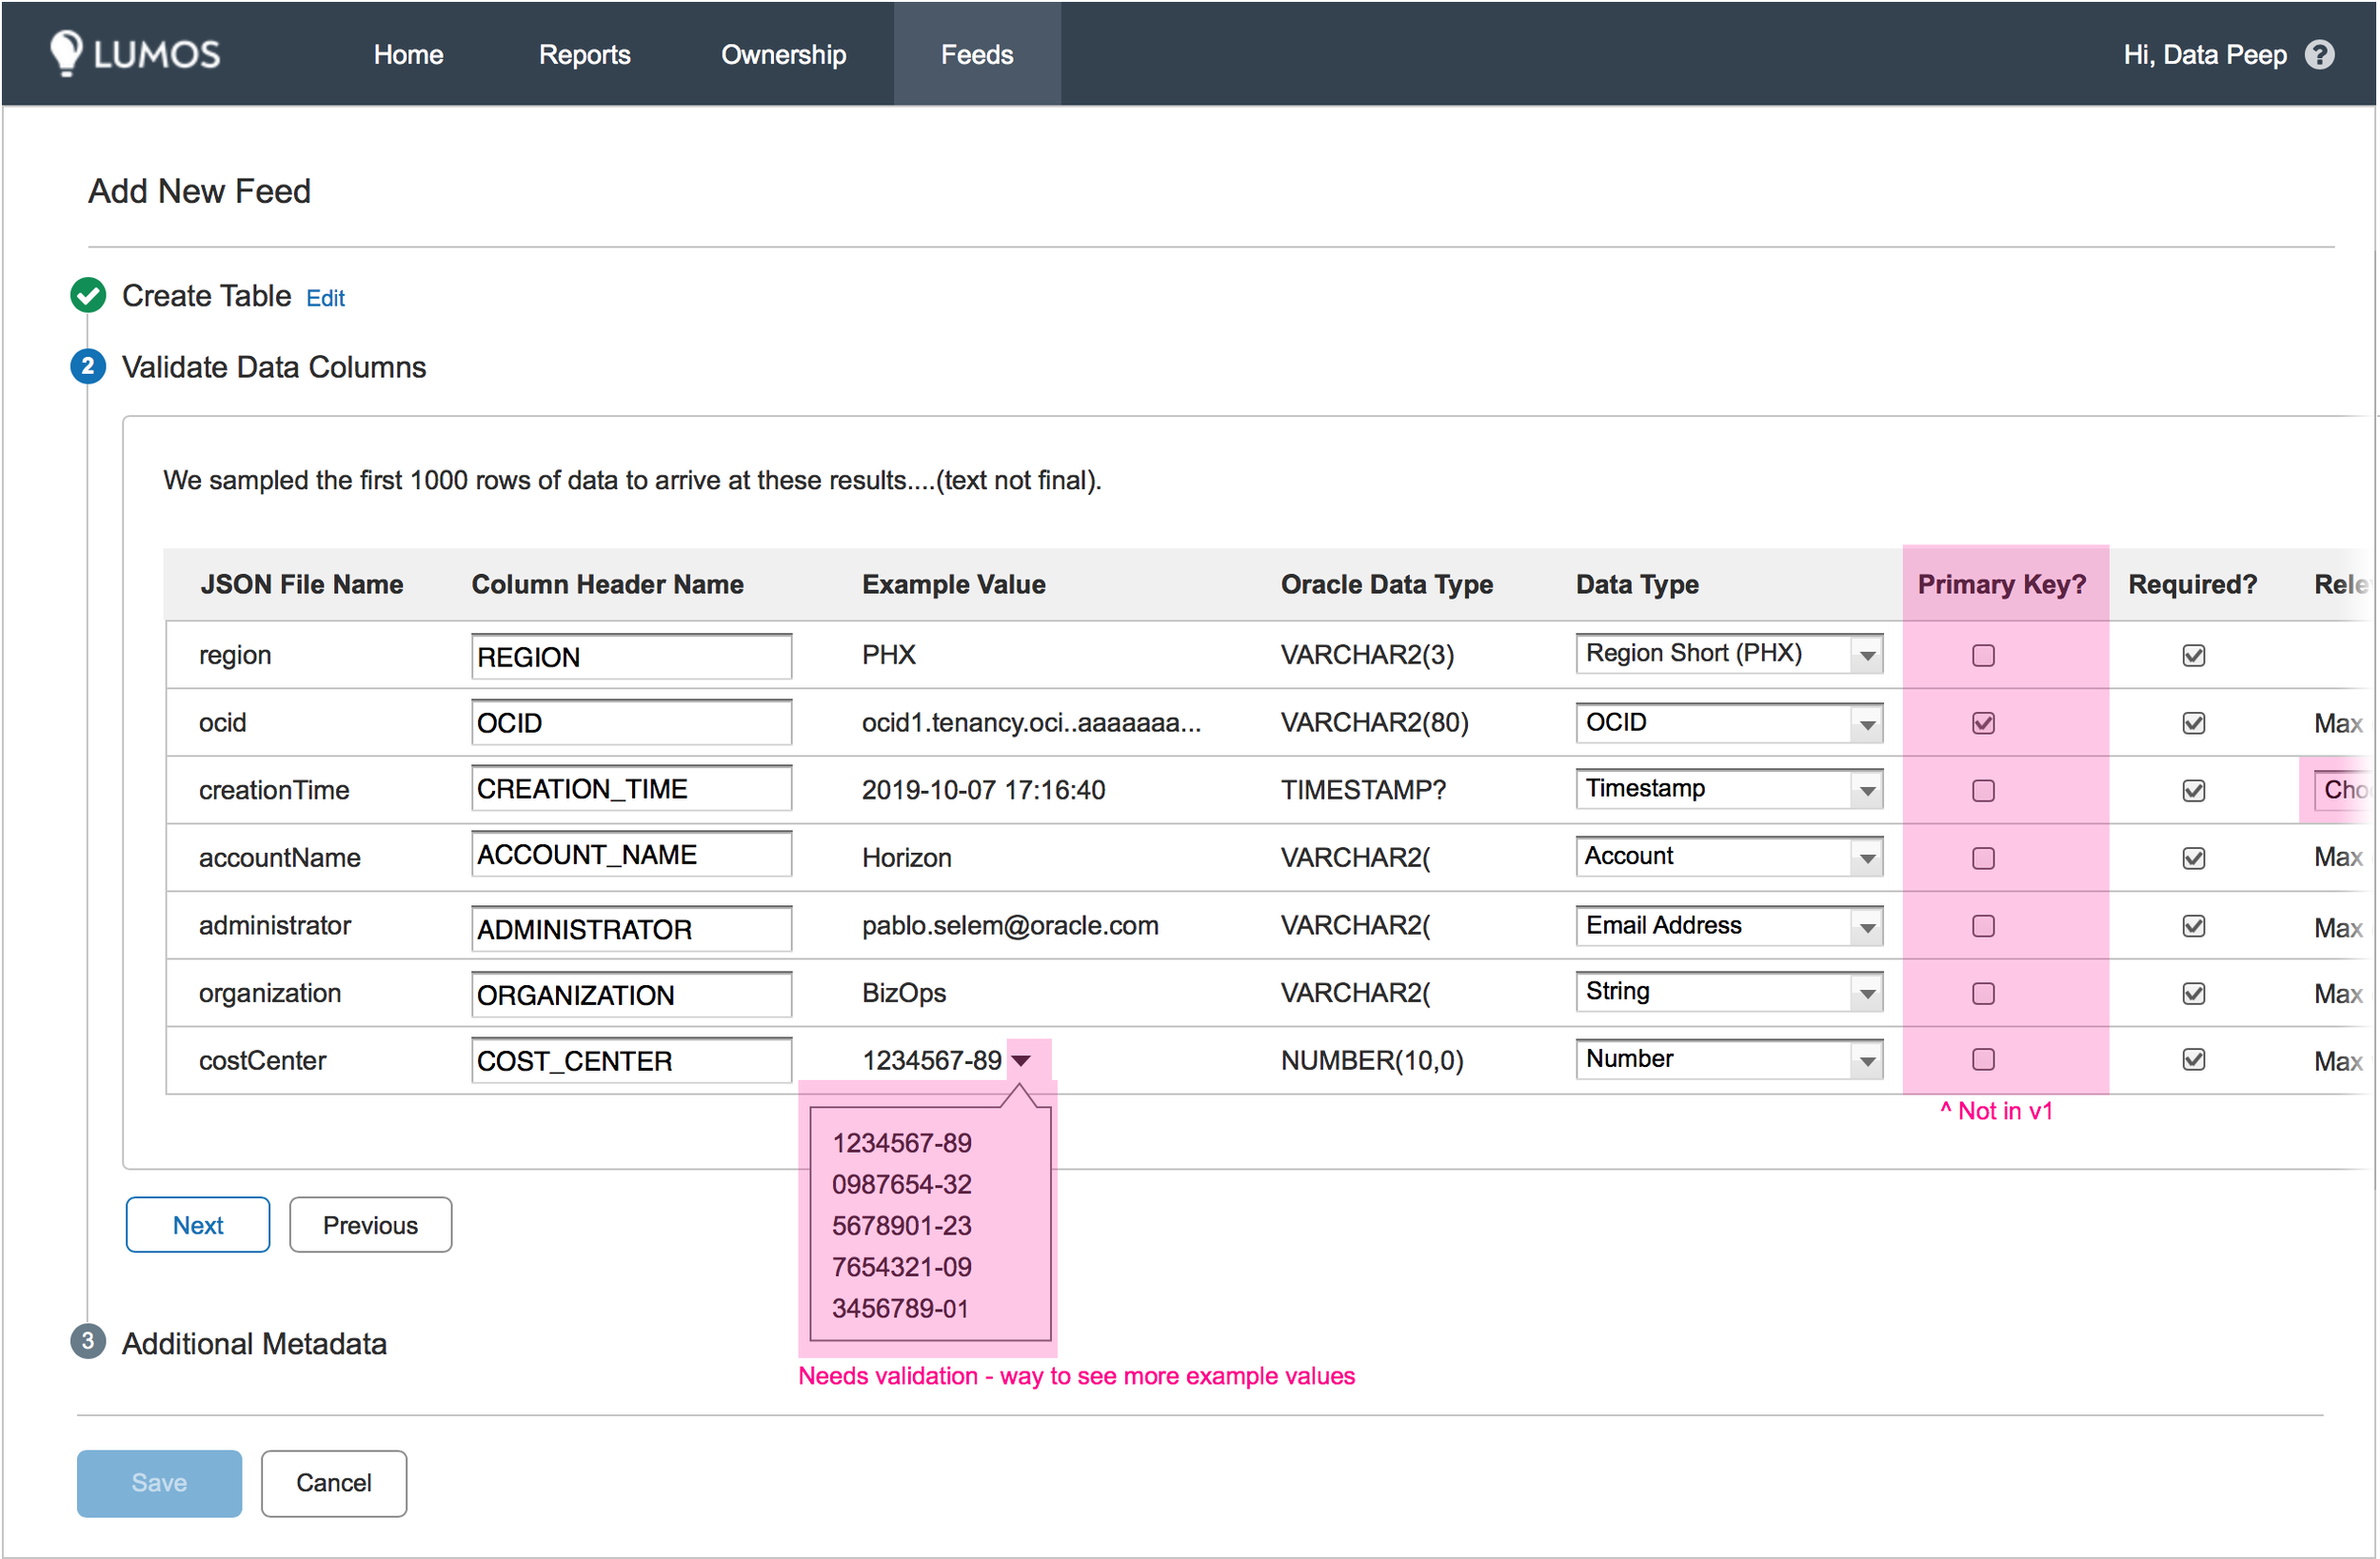
I constructed a flow that shows how the data would move through our systems and what would happen at each step. It begins with the user uploading a JSON file (the "square"). The system needs to understand the data in the JSON and transform it into data categories in the data warehouse (the "triangle"). It outputs this data in a table that the user can then verify.
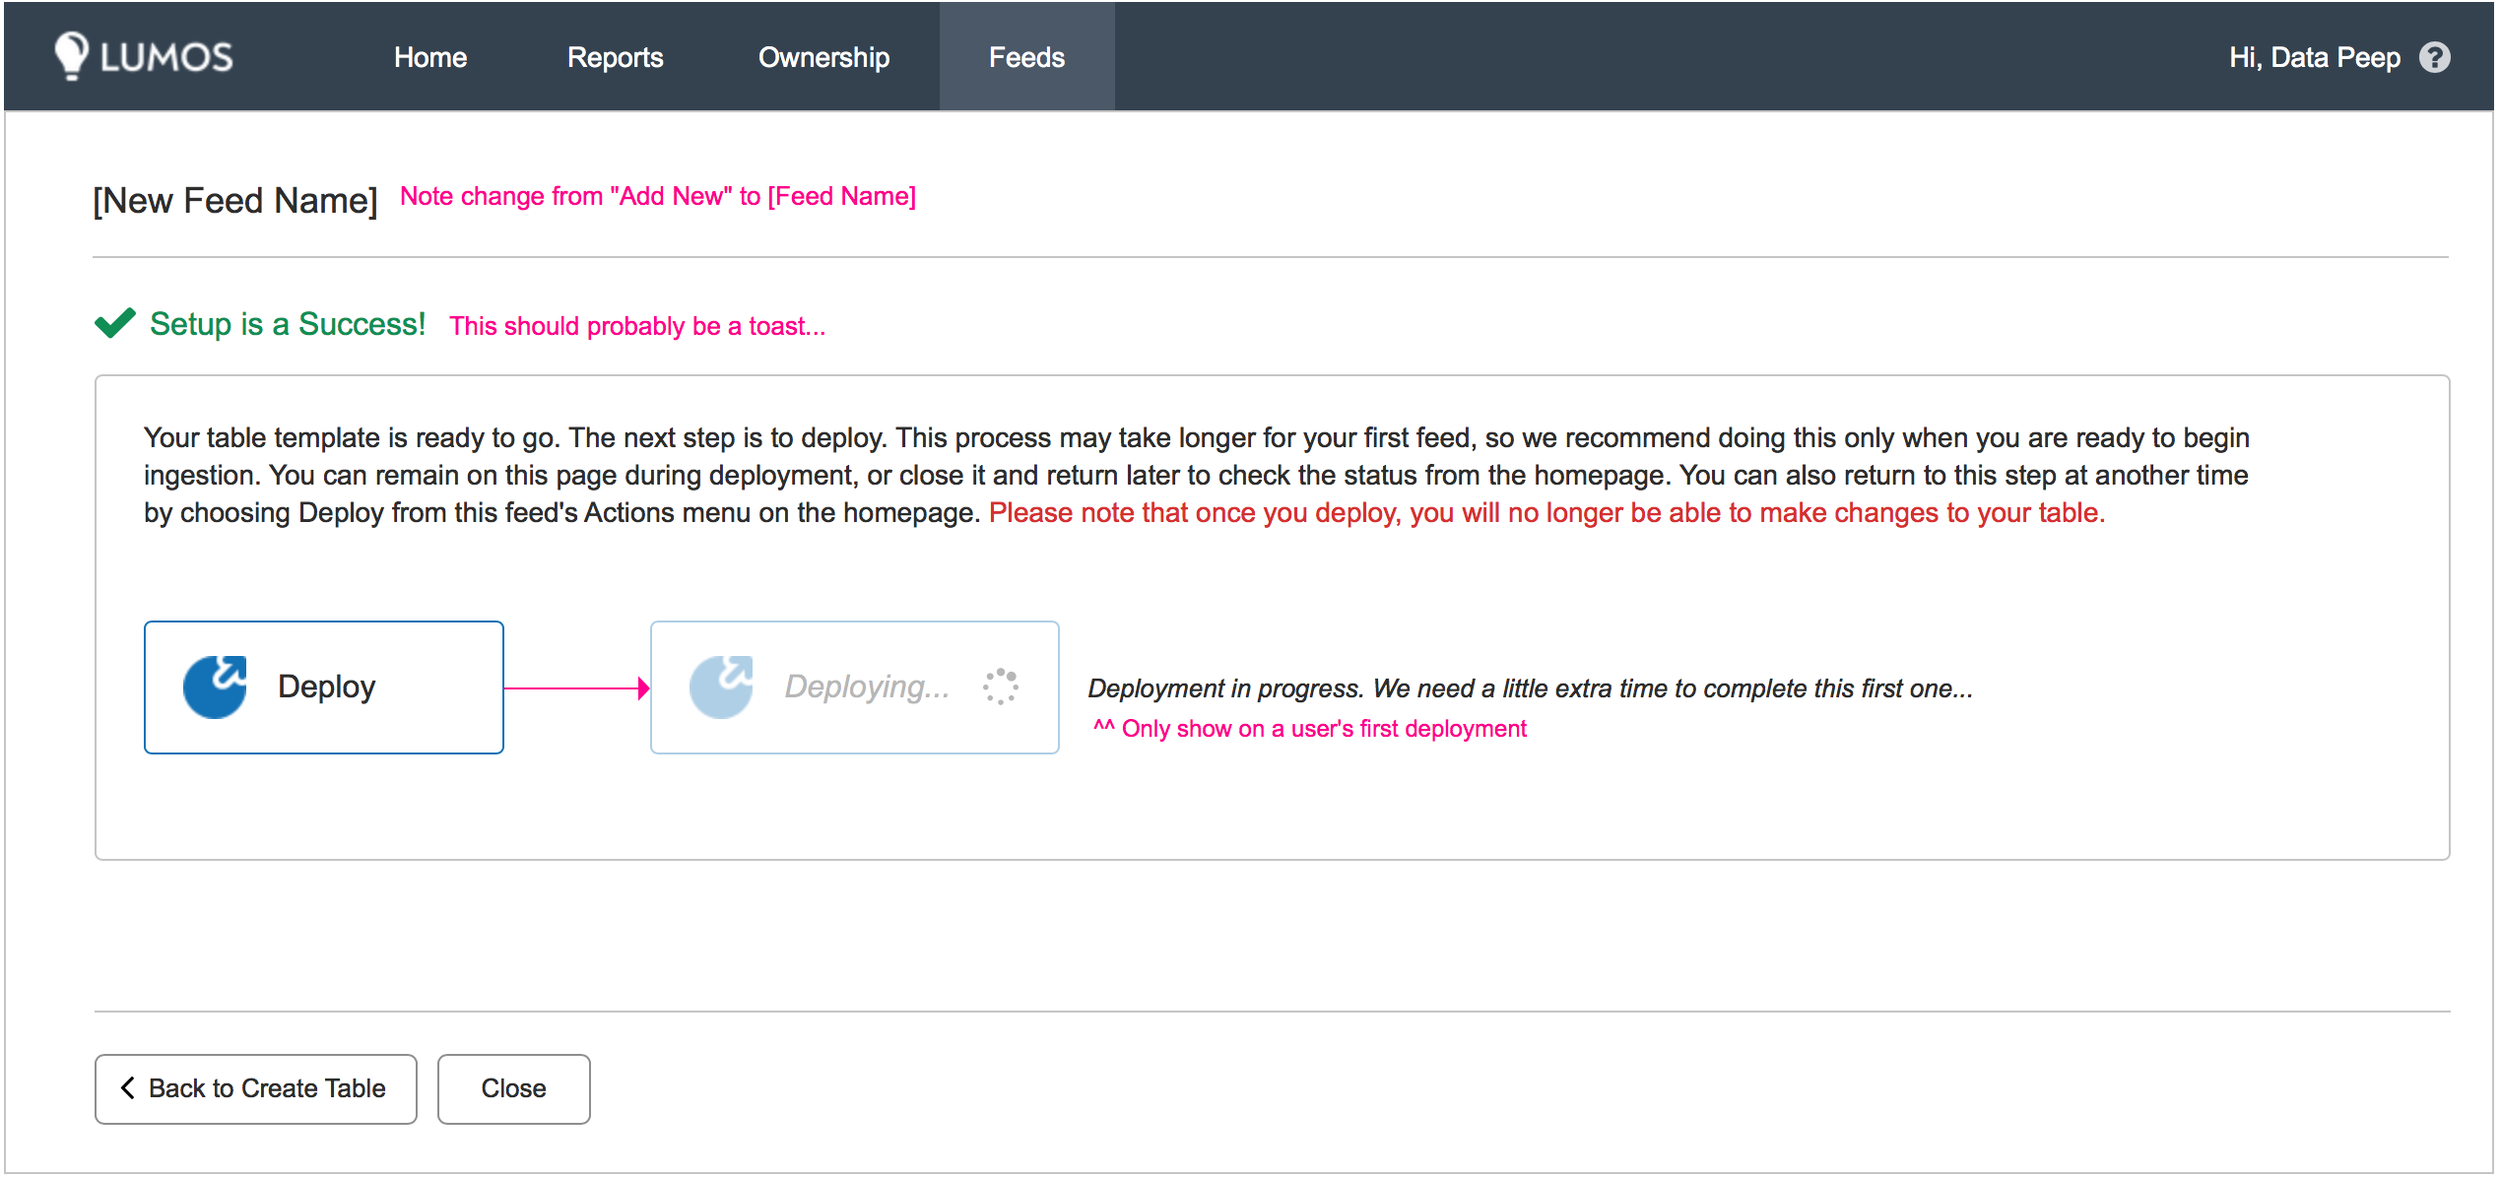
Once the user confirms everything is in order, they move to step two. This allows the user to upload a test file that our system compares against the table from step one to see if it can correctly output the data into the correct structure (we're sure the "square" was successfully converted to a "triangle"). If step two is successful, the user can move to step three, which is scheduling their data streams for automatic ingestion.


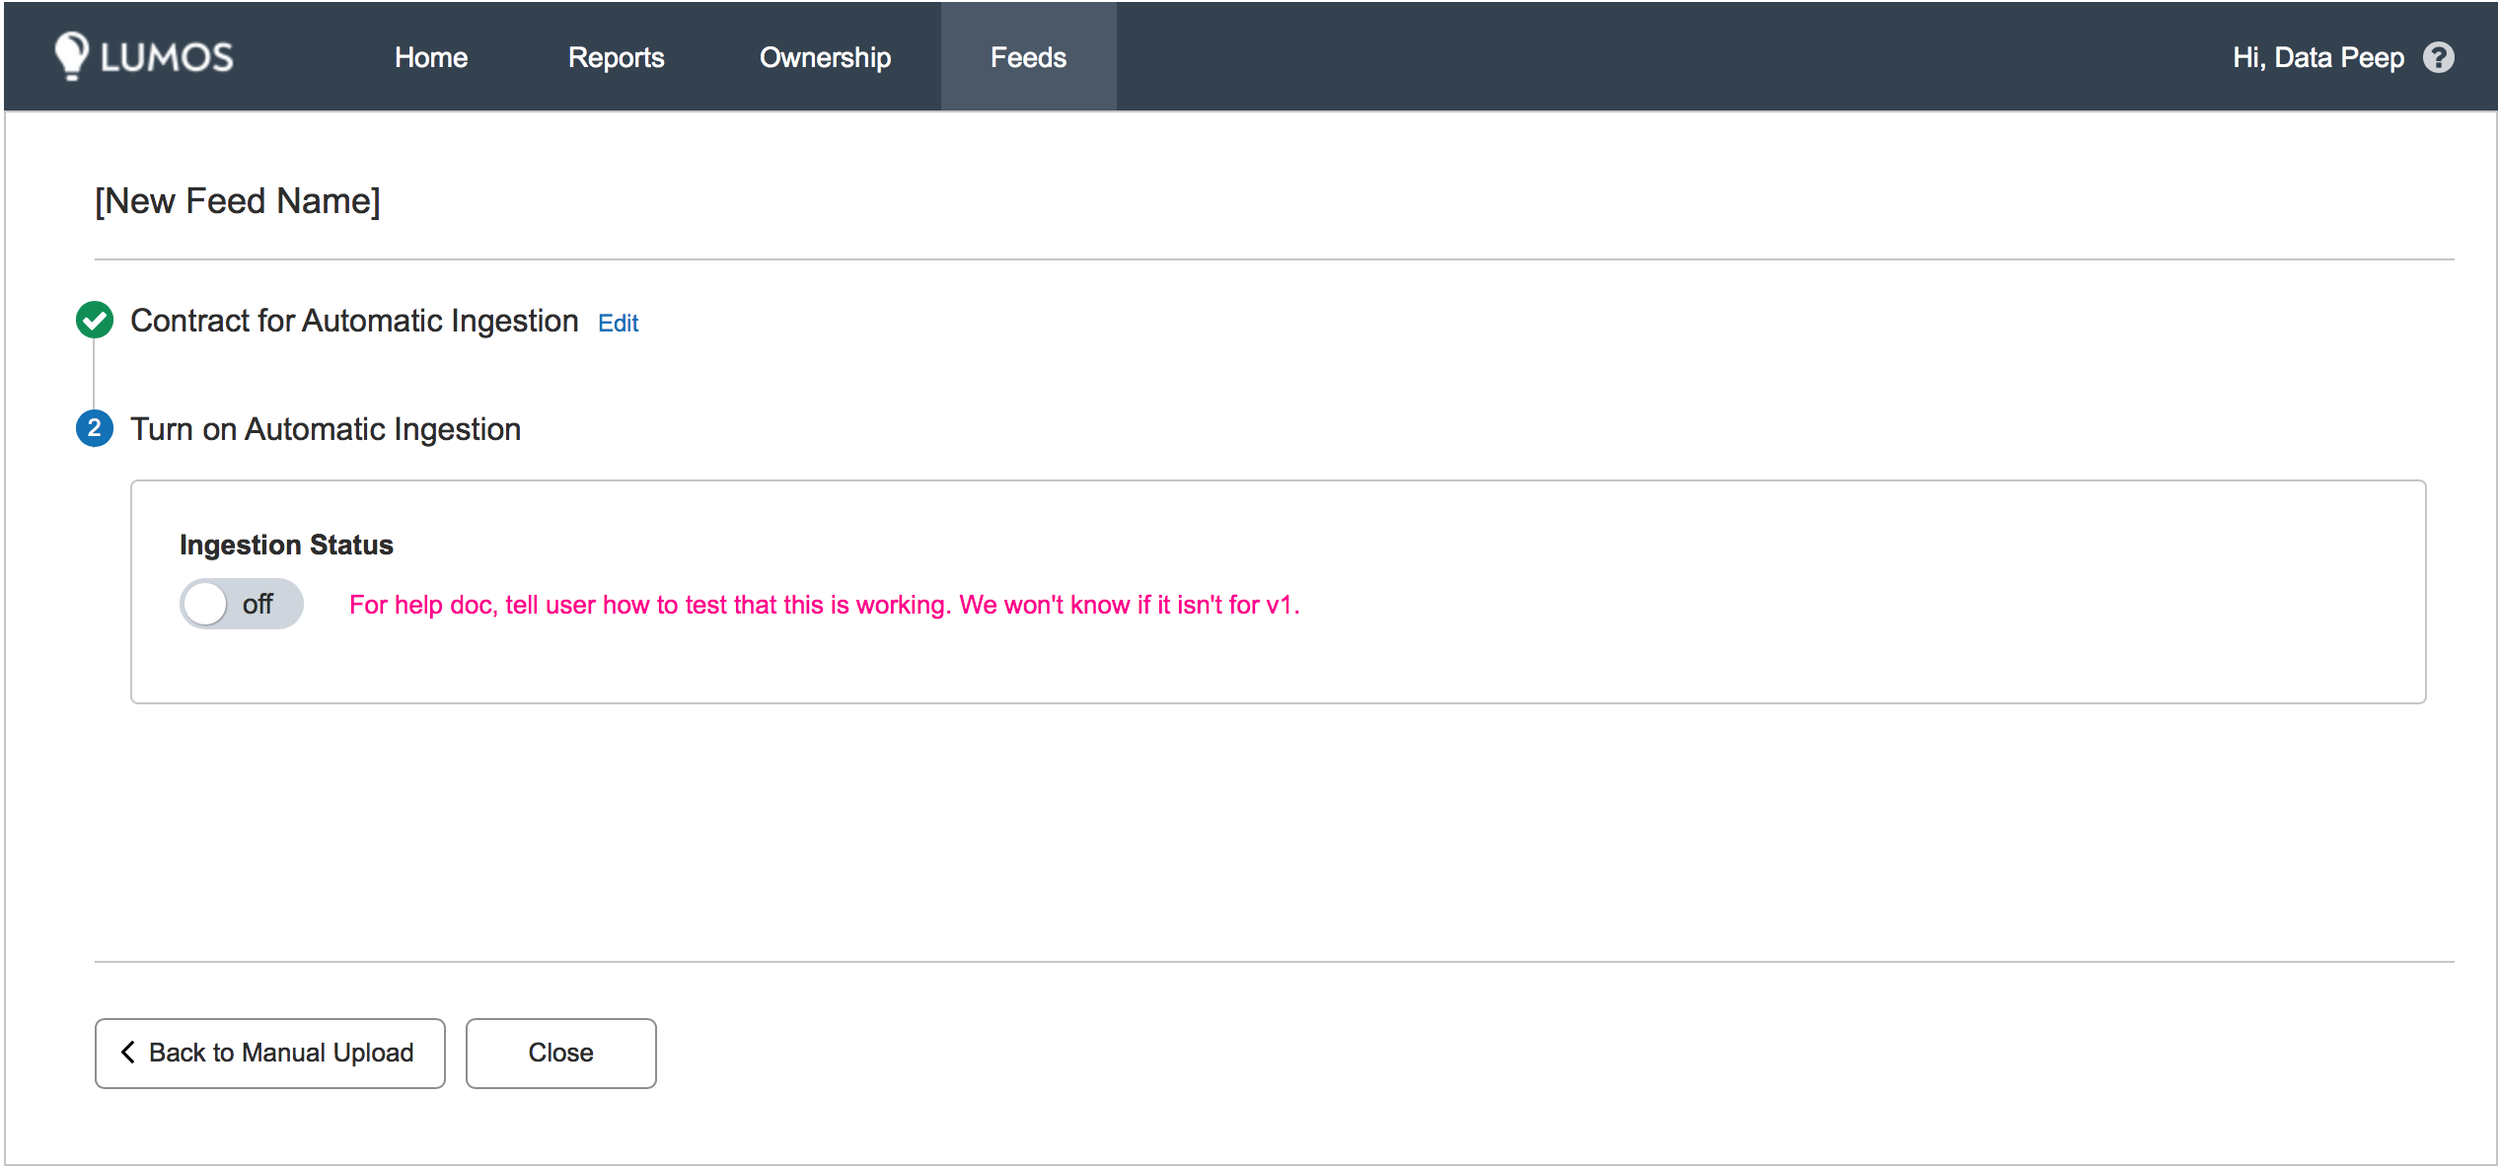
The First Screen
There were many steps in the onboarding journey so I tried several different ways of walking the user through each part. At first I thought the user would need and/or want to complete all three flows at once. When showing these to potential users, I discovered they wanted to keep those three flows distinctly separate from each other. They may want to just complete the first flow and make sure everything works, or make updates to their initial data table if there were problems.
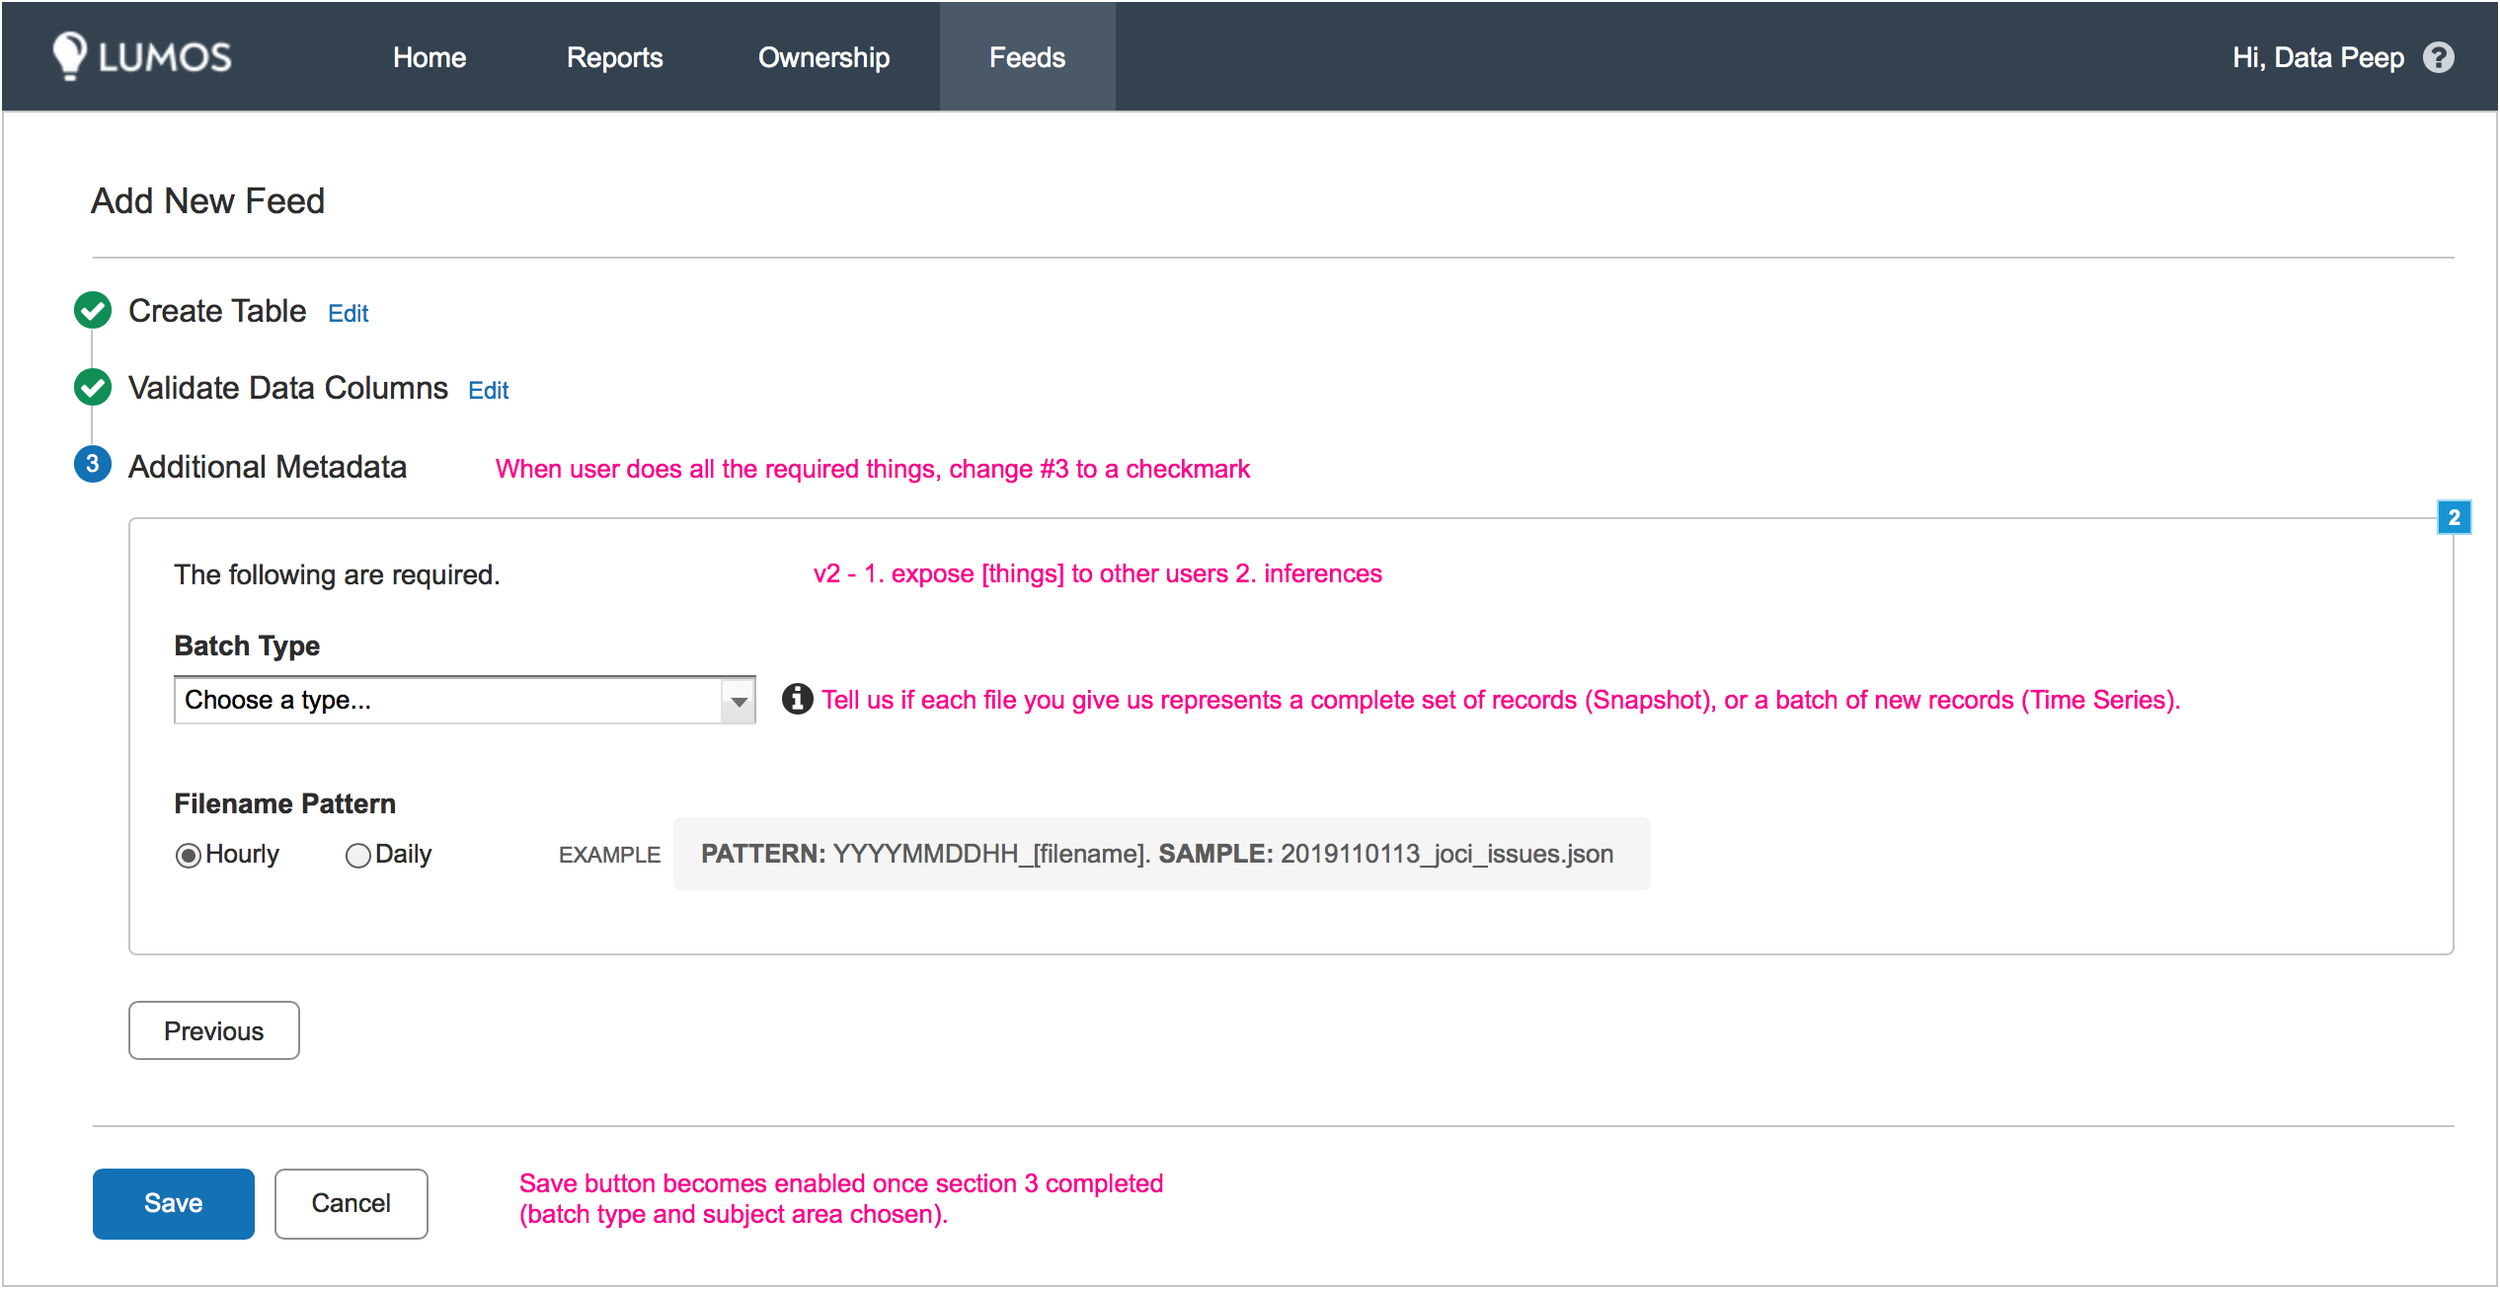
The second step involves creating virtual space on the server for the default table template, so users would only want to do this once they were sure they were ready to deploy their data and actually upload a data set. The third flow required collecting some additional meta-data and choosing manual or auto-ingestion.
Automate Actions When Possible
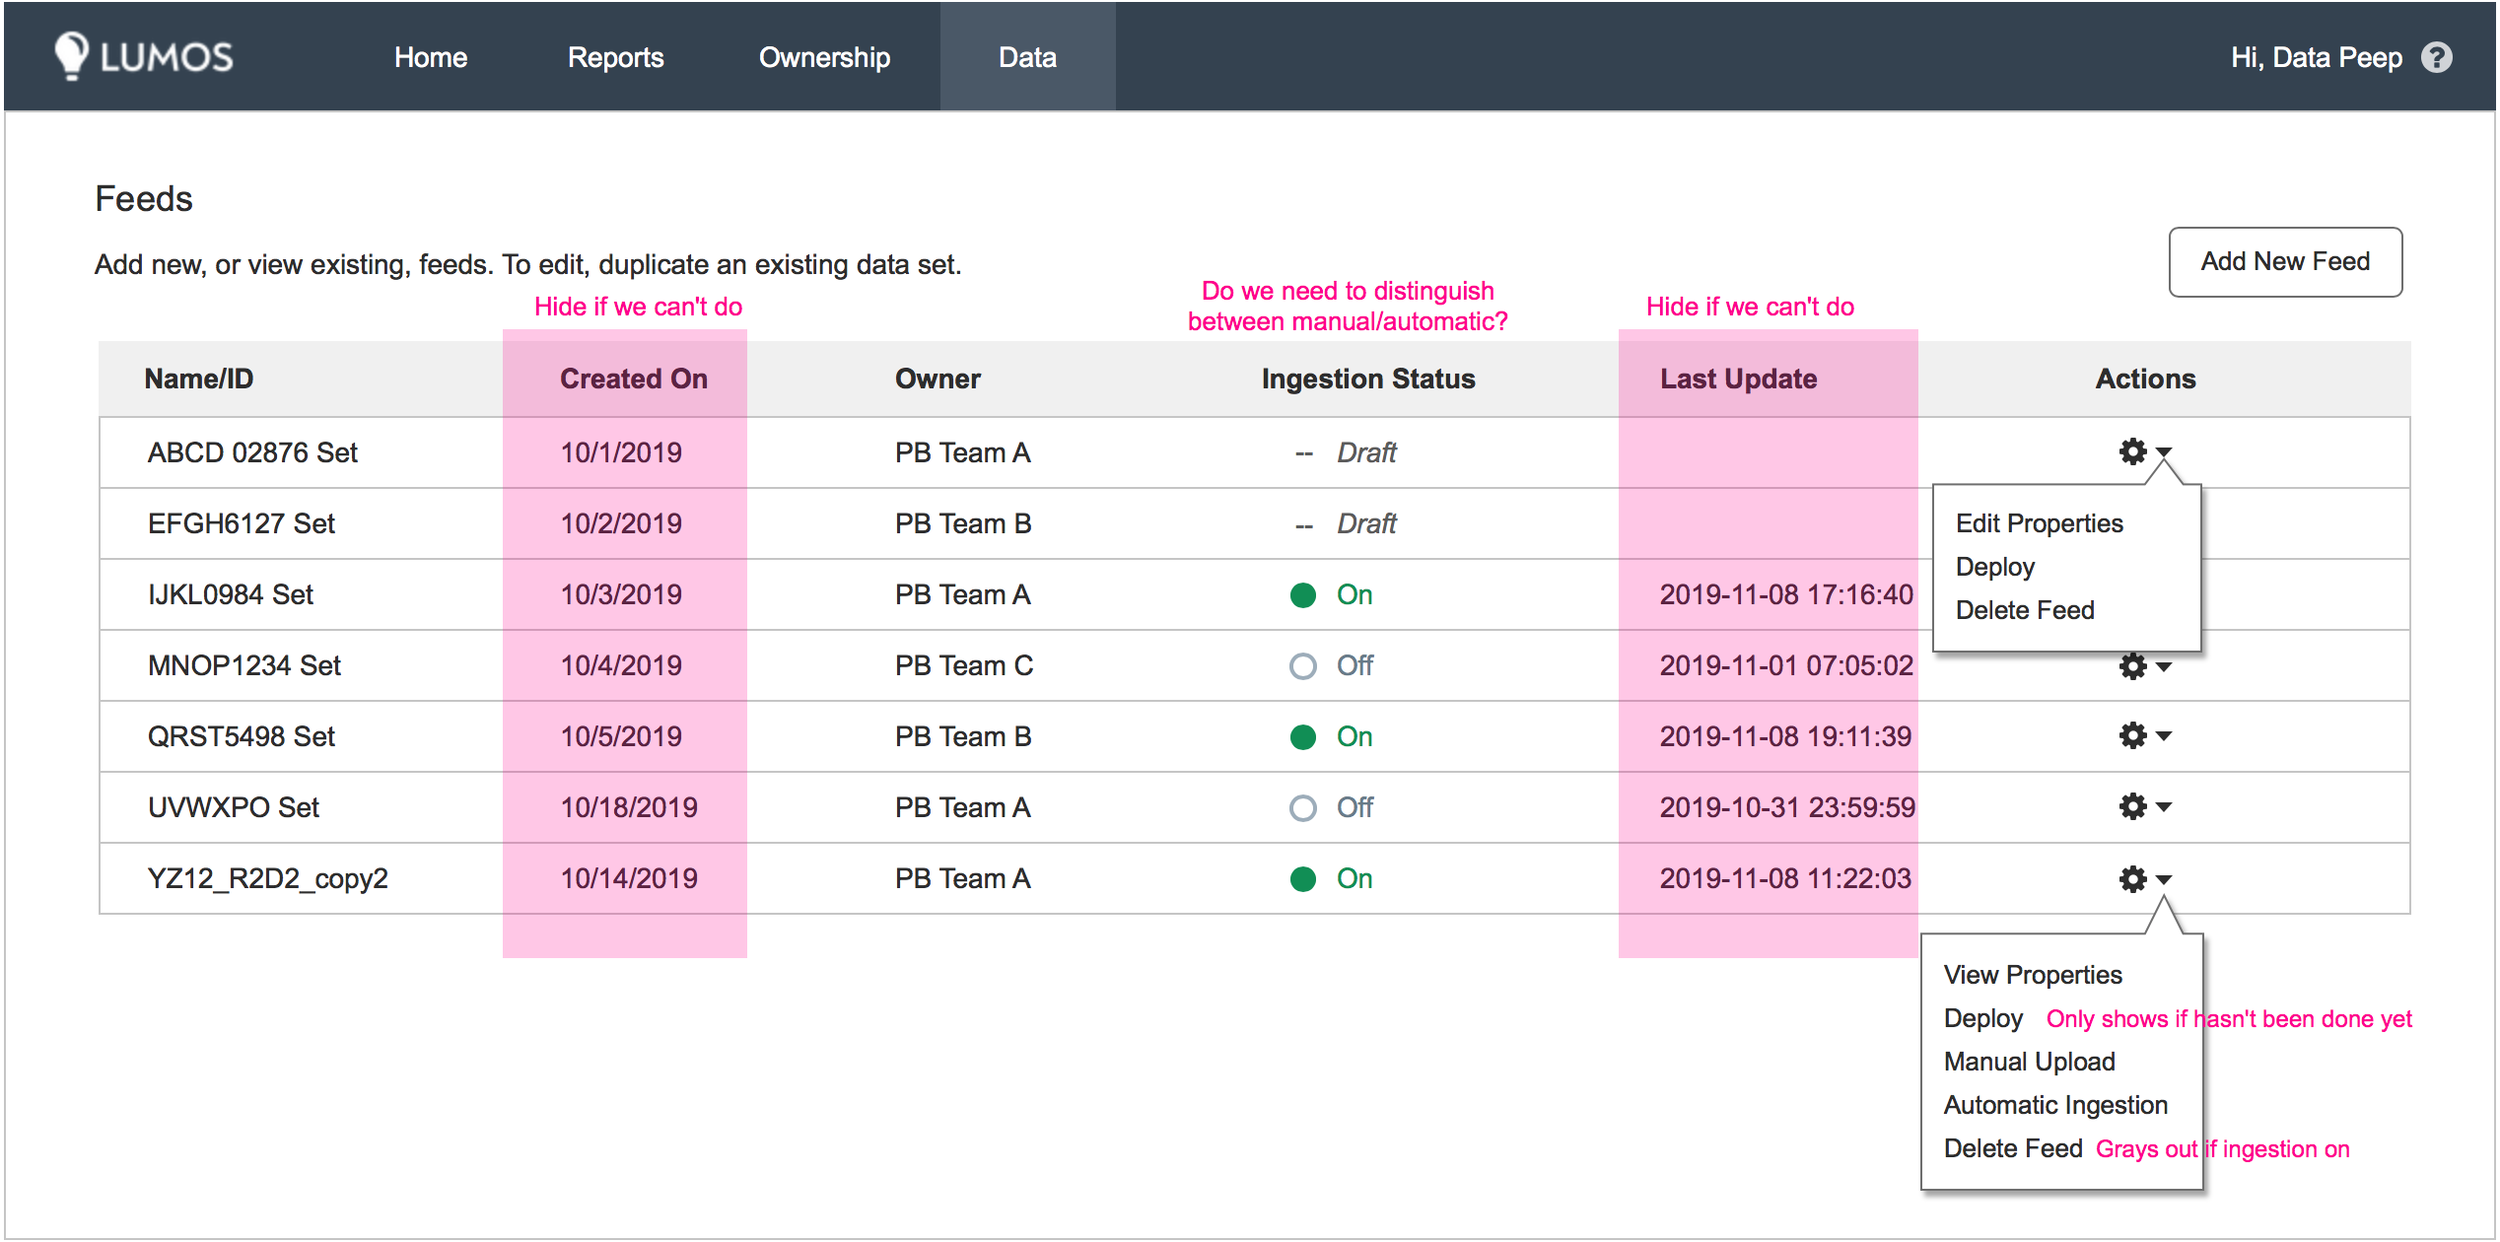
Retention and quotas are important because cloud server space is at a premium and each team gets billed for how much they use. Therefore, I wanted to inform teams of how much space they were using, and also make sure they wouldn't run out without warning and cause data reporting errors. Our lead engineer suggested a notification system warning teams when they were approaching their limit and asking them to request more. I asked if we would ever deny allocating them more space and the response from our higher ups was no. I instead suggested that we automatically bump up their allotment for them, as notifications are easily ignored or forgotten, which is the direction we went. The Quota Usage column shows how much space teams are using so they can clean up their usage bills when required.


I added an optional permissions section to the last step of flow 1.

I built a simple modal that allows for choosing approved accounts from a pre-populated dropdown.
Here Comes Compliance…
About this time the compliance team heard about our project and requested a meeting. As I was also handling PM duties, I took responsibility for gathering their requirements. Their concern was around what types of data might be sent to the data warehouse and who all would be able to access it. Data such as email addresses are considered personally protected information (PPI) and so we needed to start thinking about how to recognize such data and (ideally) automatically redact it.
Additionally, we needed to build a way for teams to restrict their data views to certain teams or individuals. Since this option would require less engineering effort to implement than redaction, I started there. This functionality had to be included before we could release our application to wider audiences, so I identified a temporary location in the first flow where we could gather and store these permissions. I knew that down the line, more permissions functionality would be required and we'd need to build some type of admin area.
Conclusion
We didn't quite meet our very short deadline due to some authorization issues the engineers ran into on the data warehouse side (auth is widely known to throw monkey wrenches around), but we still got this out in a very short timeline - about 3 months. There is still a lot to do, and I'd loved to have had more time to focus on the visual design, but this is a big win for our team. What was previously a 2-3 week manual process requiring Jira tickets between teams has been reduced to an approximately 7-10 minute task teams can do themselves. We received many accolades from our higher ups for meeting this goal and adoption is increasing as our initial beta testers spread the word throughout the company about its availability.
Postscript:
Final screens for the v1 release.